EUR/USD Intraday Technical analysis 2011-04-15

The spot rates approaches the upper limit of its medium-term bearish channel to 1.4520. A break of these levels would free up significant potential and begin a rising trend.
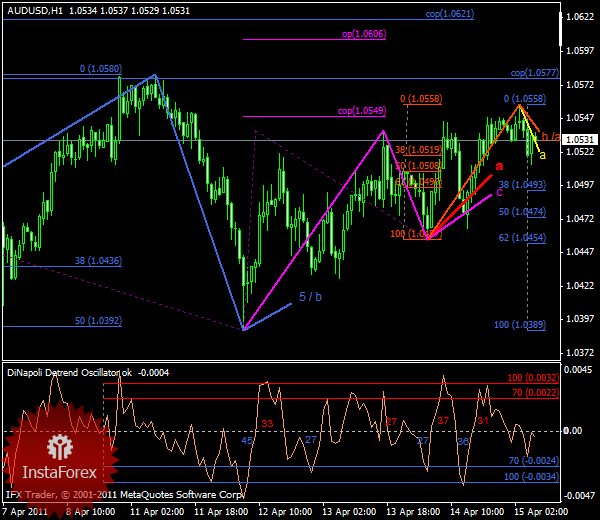
According to previous events, the market indicates a bullish opportunity as soon as the spot rate will have broken its resistance in 1.4520 with a 1st objective of 1.4610, then 1.4650. A break in 1.4490 would invalidate this scenario.
Performed by Albert Fitoussi, Analytical expert
InstaForex Companies Group © 2007-2011
GBP/USD Intraday Technical analysis 2011-04-15

The spot rates approaches the upper limit of its medium-term bearish channel to 1.6410. A break of these levels would free up significant potential and begin a rising trend.
According to previous events, the market indicates a bullish opportunity as soon as the spot rate will have broken its resistance in 1.6410 with a 1st objective of 1.6520, then 1.6550. A break in 1.6380 would invalidate this scenario.
Performed by Albert Fitoussi, Analytical expert
InstaForex Companies Group © 2007-2011
GOLD Intraday Technical analysis 2011-04-15
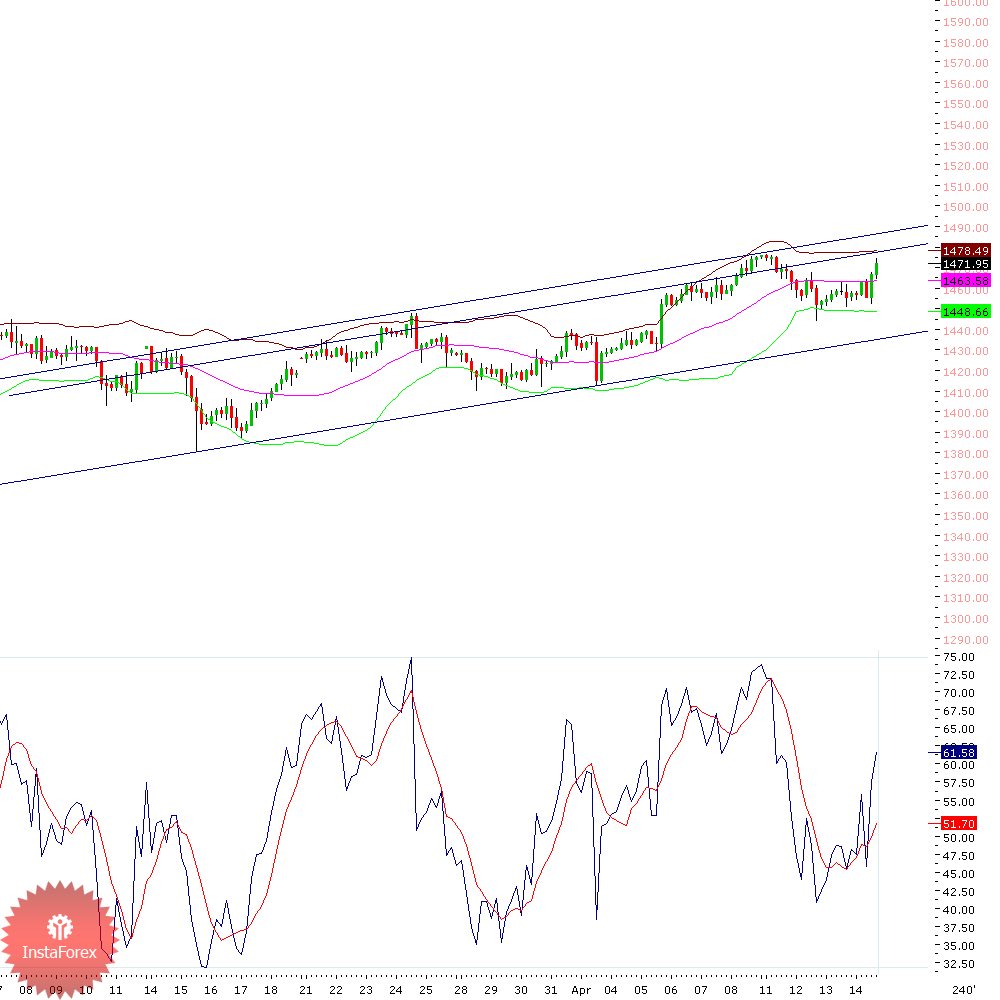
Gold is approaching the intermediate resistance of its medium term bullish channel to 1479 suggesting a decline in the short term. However a break of these levels would reach the upper limit of this one in 1489.
According to previous events, the market indicates a bullish opportunity as soon as the spot rate will have broken its resistance in 1479 with a 1st objective of 1489, then 1492. A break in 1477 would invalidate this scenario.
Performed by Albert Fitoussi, Analytical expert
InstaForex Companies Group © 2007-2011
USD/JPY Intraday Technical analysis 2011-04-15

The spot rate approaches the upper limit of its medium-term bearish channel to 83.80 suggesting a decline in the short term. However a break of these levels would free up significant potential and begin a rising trend.
According to previous events, the market indicates a bullish opportunity as soon as the spot rate will have broken its resistance in 83.80 with a 1st objective of 84.50, then 84.80. A break in 83.60 would invalidate this scenario.
Performed by Albert Fitoussi, Analytical expert
InstaForex Companies Group © 2007-2011
The USD/CHF technical analysis and trading recommendations for April 15, 2011
4-hour timeframe

Overview:
The franc price is still in the downside movement, the formed sell signal is strong and confirmed, since the Chinkou Span fixated below the price graph and the price is below the Ichimoku cloud, there are no signs of correction. Thus, at the moment the first target for the downside movement is 0.8905 – the second support level, as the price managed to pass the first one. If this level is passed the second target will be the third support level at 0.8750. Downside movement remains while the price is below the Kijun-sen (0.9000), if the price fixates above this line it is recommended to cut short positions, as the current signal would weaken. The Chinkou Span is below the price graph, which confirms the current sell signal and indicates bearish sentiment. The Bollinger bands show the beginning of the downside movement, the lines are diverging and directed down. The MACD is ascending, however we do not see any upside movement; the price is steadily declining, thus we can ignore this indicator.
Trading recommendations:
Currently it is recommended to trade down with target at 0.8905 and further to 0.8750. Stop Loss should be placed above 0.9000.
In addition to technical image, one should take into account the fundamental data and the time of their release.
The chart annotation:
Ichimoku indicator:
Tenkan-sen - red line
Kijun-Sen - blue line
Senkou Span A - light brown stipple line
Senkou Span B - light purple stipple line
Chinkou Span - green line
Bollinger Bands indicator:
3 yellow lines
MACD indicator:
The red line and the histogram with white bars in the indicators window.
Performed by Stanislav Polyanskiy, Analytical expert
InstaForex Companies Group © 2007-2011
The EUR/USD technical analysis and trading recommendations for April 15, 2011
4-hour timeframe

Overview:
The euro is still observing a buy signal, however a sideways movement is in advance, which is demonstrated by the Bollinger Bands, therefore it is recommended to resume trading up after the correction ends. The formed buy signal is strong and confirmed, since the Chinkou Span fixated above the price graph and the price is above the Ichimoku cloud. Thus, at the moment the first target for the upside movement is 1.4599 – the first resistance level. If this level is passed the second target will be the second resistance level at 1.4713. Upside movement remains while the price is above the Kijun-sen (1.4440), if the price fixates below this line it is recommended to cut long positions. The Chinkou Span is above the price graph, which confirms the current buy signal and indicates bullish sentiment. The Bollinger bands show the ending upside movement, the lines are not diverging and directed sideways, which is also a beginning of the sideways movement. The MACD is ascending, which indicates current upside movement, which is probably limited by the sideways channel.
Trading recommendations:
Currently it is recommended to trade up with target at 1.4599 and further to 1.4713. Stop Loss should be placed below 1.4440. Long positions should be opened after the Bollinger Bands start to diverge to the upside.
In addition to technical image, one should take into account the fundamental data and the time of their release.
The chart annotation:
Ichimoku indicator:
Tenkan-sen - red line
Kijun-Sen - blue line
Senkou Span A - light brown stipple line
Senkou Span B - light purple stipple line
Chinkou Span - green line
Bollinger Bands indicator:
3 yellow lines
MACD indicator:
The red line and the histogram with white bars in the indicators window.
Performed by Stanislav Polyanskiy, Analytical expert
InstaForex Companies Group © 2007-2011
Register InstaForex Broker » Here
Sunday, April 17, 2011 | 7
comments | Read More