Hi, Trader ! welcome to Knowing-Forex.Blogspot.com. | About Us | Contact | Sign In
Forex Info :

Real Time Visitor

free counters

Technical Analysis for April 15, 2011


EUR/USD Intraday Technical analysis 2011-04-15


The spot rates approaches the upper limit of its medium-term bearish channel to 1.4520. A break of these levels would free up significant potential and begin a rising trend.

According to previous events, the market indicates a bullish opportunity as soon as the spot rate will have broken its resistance in 1.4520 with a 1st objective of 1.4610, then 1.4650. A break in 1.4490 would invalidate this scenario.


Performed by Albert Fitoussi, Analytical expert
InstaForex Companies Group © 2007-2011


GBP/USD Intraday Technical analysis 2011-04-15


The spot rates approaches the upper limit of its medium-term bearish channel to 1.6410. A break of these levels would free up significant potential and begin a rising trend.

According to previous events, the market indicates a bullish opportunity as soon as the spot rate will have broken its resistance in 1.6410 with a 1st objective of 1.6520, then 1.6550. A break in 1.6380 would invalidate this scenario.


Performed by Albert Fitoussi, Analytical expert
InstaForex Companies Group © 2007-2011


GOLD Intraday Technical analysis 2011-04-15
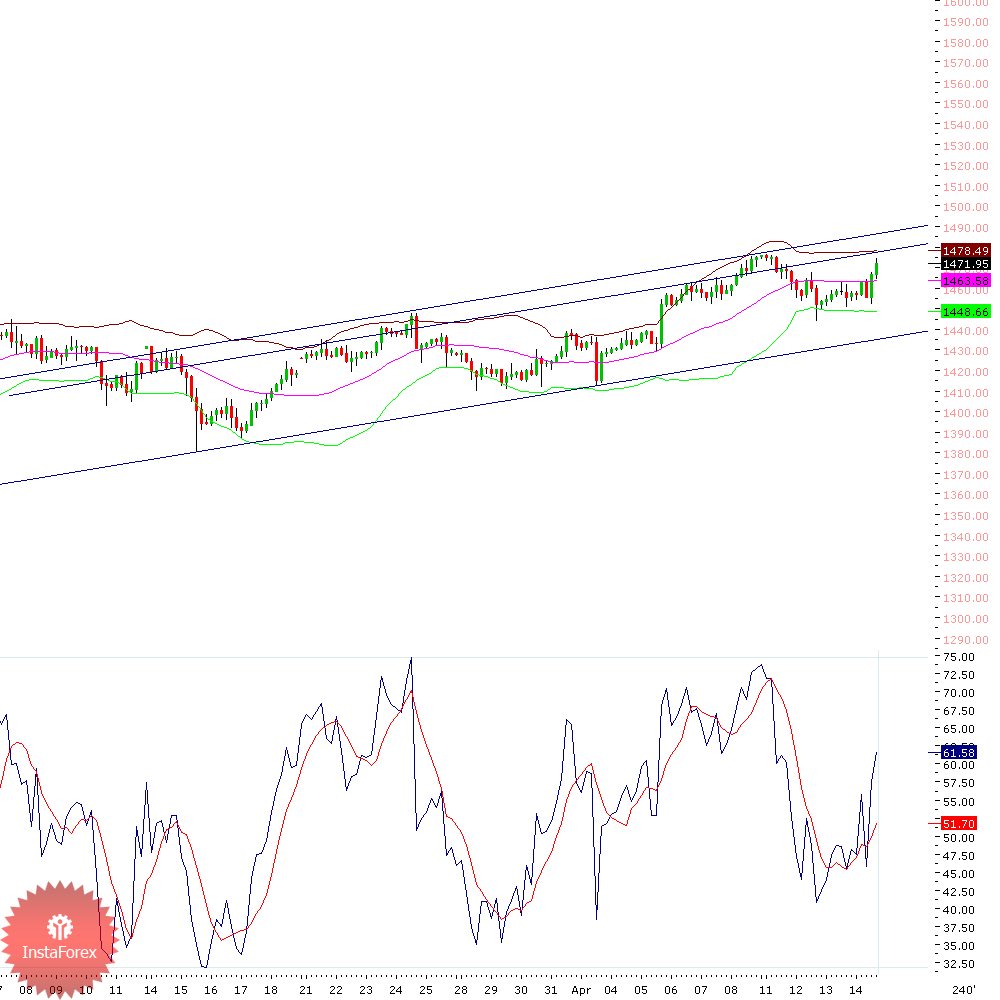

Gold is approaching the intermediate resistance of its medium term bullish channel  to 1479 suggesting a decline in the short term. However a break of these levels would reach the upper limit of this one in 1489.

According to previous events, the market indicates a bullish opportunity as soon as the spot rate will have broken its resistance in 1479 with a 1st objective of 1489, then 1492. A break in 1477 would invalidate this scenario.


Performed by Albert Fitoussi, Analytical expert
InstaForex Companies Group © 2007-2011


USD/JPY Intraday Technical analysis 2011-04-15


The spot rate approaches the upper limit of its medium-term bearish channel to 83.80 suggesting a decline in the short term. However a break of these levels would free up significant potential and begin a rising trend.

According to previous events, the market indicates a bullish opportunity as soon as the spot rate will have broken its resistance in 83.80 with a 1st objective of 84.50, then 84.80. A break in 83.60 would invalidate this scenario.


Performed by Albert Fitoussi, Analytical expert
InstaForex Companies Group © 2007-2011


The USD/CHF technical analysis and trading recommendations for April 15, 2011

4-hour timeframe


Overview:

The franc price is still in the downside movement, the formed sell signal is strong and confirmed, since the Chinkou Span fixated below the price graph and the price is below the Ichimoku cloud, there are no signs of correction. Thus, at the moment the first target for the downside movement is 0.8905 – the second support level, as the price managed to pass the first one. If this level is passed the second target will be the third support level at 0.8750. Downside movement remains while the price is below the Kijun-sen (0.9000), if the price fixates above this line it is recommended to cut short positions, as the current signal would weaken. The Chinkou Span is below the price graph, which confirms the current sell signal and indicates bearish sentiment. The Bollinger bands show the beginning of the downside movement, the lines are diverging and directed down. The MACD is ascending, however we do not see any upside movement; the price is steadily declining, thus we can ignore this indicator.

Trading recommendations:

Currently it is recommended to trade down with target at 0.8905 and further to 0.8750. Stop Loss should be placed above 0.9000.
In addition to technical image, one should take into account the fundamental data and the time of their release.

The chart annotation:

Ichimoku indicator:
Tenkan-sen - red line
Kijun-Sen
- blue line
Senkou Span A
- light brown stipple line
Senkou Span B
- light purple stipple line
Chinkou Span
- green line

Bollinger Bands indicator:
3 yellow lines

MACD indicator:
The red line and the histogram with white bars in the indicators window.


Performed by Stanislav Polyanskiy, Analytical expert
InstaForex Companies Group © 2007-2011


The EUR/USD technical analysis and trading recommendations for April 15, 2011

4-hour timeframe


Overview:

The euro is still observing a buy signal, however a sideways movement is in advance, which is demonstrated by the Bollinger Bands, therefore it is recommended to resume trading up after the correction ends. The formed buy signal is strong and confirmed, since the Chinkou Span fixated above the price graph and the price is above the Ichimoku cloud. Thus, at the moment the first target for the upside movement is 1.4599 – the first resistance level. If this level is passed the second target will be the second resistance level at 1.4713. Upside movement remains while the price is above the Kijun-sen (1.4440), if the price fixates below this line it is recommended to cut long positions. The Chinkou Span is above the price graph, which confirms the current buy signal and indicates bullish sentiment. The Bollinger bands show the ending upside movement, the lines are not diverging and directed sideways, which is also a beginning of the sideways movement. The MACD is ascending, which indicates current upside movement, which is probably limited by the sideways channel.

Trading recommendations:

Currently it is recommended to trade up with target at 1.4599 and further to 1.4713. Stop Loss should be placed below 1.4440. Long positions should be opened after the Bollinger Bands start to diverge to the upside.

In addition to technical image, one should take into account the fundamental data and the time of their release.


The chart annotation:

Ichimoku indicator:
Tenkan-sen
- red line
Kijun-Sen
- blue line
Senkou Span A
- light brown stipple line
Senkou Span B
- light purple stipple line
Chinkou Span
- green line

Bollinger Bands indicator:
3 yellow lines

MACD indicator:
The red line and the histogram with white bars in the indicators window.


Performed by Stanislav Polyanskiy, Analytical expert
InstaForex Companies Group © 2007-2011


Register InstaForex Broker » Here
Sunday, April 17, 2011 | 7 comments | Read More

Forecast for April 13, 2011


USD/JPY Daily Forecast for April 13, 2011


DAILY  FORECAST :


Today the USD/JPY has been trading between the 5 periode Moving Avarage and the 20 periode Moving Avarage and in the range between 83.59 and the 84.21 levels. These two levels have a potential to be tested by this pair today, but if we look at the daily charts, the Stochastic studies is still in a Bearish Mode; so we predict that today the pair will test the support at 83.59 and the 3 days low at the 83.48 level. On the other hand, if the Resistance 84.21 can be broken by this pair today, the USD/JPY will test the 84.50 as the first target and the 84.71 as the second target.


Performed by Arief Makmur, Analytical expert
InstaForex Companies Group © 2007-2011


EUR/USD Daily Forecast for April 13, 2011


DAILY  FORECAST :


Today this pair has a chance to trade in a sideways  situation, because yesterday it closed in a range between the April 8th / 2011 high and low bar. It seems the EUR/USD will be trading between 1.4437 and the yesterday's high at 1.4518, if the yesterday's high can be broken out, this pair will test the next Resistance at 1.4550; however, because the Stochastic Studies is in "overbought" area, there's a chance the pair will get some correction or retracement, if the 1.4434 can be broken, it will have a chance to go down to 1.4422 as the first target and the 1.4378 as the second target.


Performed by Arief Makmur, Analytical expert
InstaForex Companies Group © 2007-2011


Register InstaForex Broker » Here
Sunday, April 17, 2011 | 0 comments | Read More

Stock Markets for April 13, 2011


Wheat review for April 13, 2011


By the end of CBOT trades the prices for May futures on wheat declined by 6 ¾ cent (1.7%), by 7.52 ¾ US dollars per bushel. The US meteorological service forecasts precipitations in the region of the Great Plains which improves expectations of the market regarding the quality of winter wheat harvest.

However, other regions of wheat cultivation (Texas and Oklahoma) are expected to get less moisture than needed that is why rainless weather will be unfavourable for harvest. Yet, traders’ attention has been focused on the news about rain in Kansas and Nebraska since there are concerns over precipitations in other US states which is to brighten the situation with harvest. Under all these circumstances traders decided to close part of long positions.

Besides, as exports data showed, The Middle East countries continued buying American wheat, in smaller volume though. It exacerbated the concerns over demand decline of demand due to high prices.


Performed by Vladimir Donin, Analytical expert
InstaForex Companies Group © 2007-2011


Cattle review for 13 April, 2011


Futures on cattle grew on Wednesday amid purchases for lowered prices. Earlier futures dropped to their lows for week and a half. By the end of CME trades, April futures on cattle increased by 0.60 cent (0.51%) up to 1.1827 US dollars per pound. June contract closed with a gain of 0.17 cent having thus constituted 1.3302 US dollars per pound.

Futures increased amid weakening US dollar which has been intensifying the expectations of export demand growth, even though import demand showed decrease.

Dropping US dollar makes futures less expensive for those who operate with other currencies.
Another source of support for the market is the growth of prices for lean pork. They rose amid the prospects of seasonal decline in supply.

Market participants consider that futures growth may well continue after last week large-scale sales. On the other hand, cash prices for beef tend to decrease in mid-April as more meat comes to the market. Prices fall is indispensable for demand to grow. At the same time export sales can support the market. Yet, many traders have been expressing concerns over high wholesale prices possible to have an opposite effects.

These concerns exacerbated shortly after the US Agriculture Department announced the wholesale prices for beef to have grown by 0.43 cent per pound.


Performed by Vladimir Donin, Analytical expert
InstaForex Companies Group © 2007-2011


Register InstaForex Broker » Here
Saturday, April 16, 2011 | 1 comments | Read More

Review for April 14, 2011


USD Review 14-04-2011


USD againts Major Pair Review :

The USD Dollar weakened againts almost all major pairs except  the GBP that traded in a ranging situation againts the USD. Againts the EUR, CHF and the YEN, the USD is still in a downside situation.


USD Againts Commdoll :


Againts the Commodity Dollar Pair, the USD still looks weak as well, event againts the CAD and the AUD, the USD strengthened slightly, but the bearish pressure for the USD is still in advance.


Conclusion :

Because the USD still has a bearish pressure in almost all Major Pair and the Commodity Dollar, we predict for today that the USD will be still in a downtrend situation againts all the major and the comdoll pair.


Performed by Arief Makmur, Analytical expert
InstaForex Companies Group © 2007-2011


EURO Review 14-04-2011


EURO Againts Major pair :


The Euro Pair  won againts the USD and the GBP pair, but againts the YEN and CHF pair, the Euro Dollar declined.


EURO Againts Commdoll :

Againts the AUD, it seems the Euro Pair traded in a ranging situaion (red: the Buyeers and Sellers its equal), the Euro got a temporary winning side before the pair came back  into the sideways range; However the Euro Pair is still a winner againts the Loonie, However againts the Kiwi, the Euro Pair is in a losing situation.


Conclusion :

Because againts the majors only two Euro Dollar wins and with the two other the Euro Pair loses, againts the Comdoll one pair is in a sideways movement, the other wins, and the rest lose, we predict based on all the facts that we've already mentioned above, the Euro Pair is now in the "Overbought" situation .


Performed by Arief Makmur, Analytical expert
InstaForex Companies Group © 2007-2011


Register InstaForex Broker » Here
Saturday, April 16, 2011 | 0 comments | Read More

Wave Analysis for April 15, 2011


AUD/USD Elliott wave count and Fibonacci levels - April 15, 2011

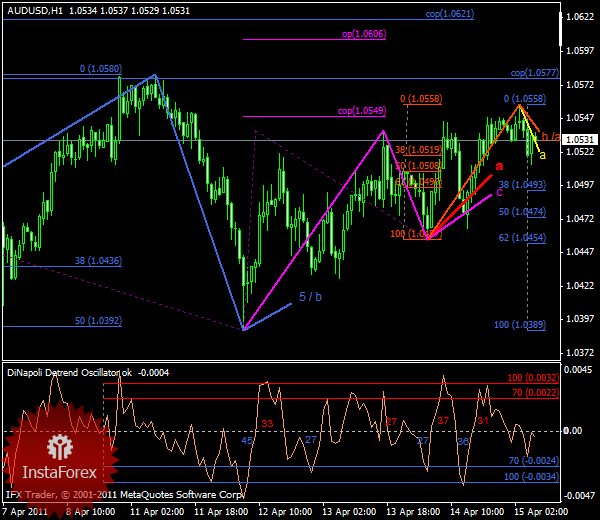
AUD/USD is developing potential wave 5 of medium term uptrend - colored royal blue in the chart. To confirm wave 5 break above 1.0580 is needed. On smaller timeframes this wave consists of A-B-C subwaves (colored magenta in the chart) with subwave C still developing. The targets of the upmove are Fibonacci expansions off 0.9709-1.0313-1.0204 (waves 1-2), 1.0204-1.0580-1.0389 (waves 3-4), 1.0389-1.0538-1.0457 (subwaves A-B).

Resistances:

- 1.0577 = contracted objective point (COP)
- 1.0606 = objective point (OP)
- 1.0621 = COP
- 1.0698 = expanded objective point (XOP)

If the price keeps declining the immediate supports will be Fibonacci retracements of 1.0457-1.0558, 1.0389-1.0558, 1.0204-1.0580.

Supports:

- 1.0508 = .50 retracement
- 1.0496-93 = confluence area of .618 and .382 retracements
- 1.0474 = .50 ret
- 1.0454 = .618 ret


Overbought/Oversold

Assuming that the medium term trend is up (wave of a larger degree is now up), it's preferable to look for longs when the Detrended Oscillator goes below the zero level (current prices) or gets into the oversold area (20-30 pips below the current prices - this roughly corresponds to 1.0508 Fib support).


Performed by Roman Molodiashin, Analytical expert
InstaForex Companies Group © 2007-2011


GBP/JPY Elliott wave count and Fibonacci levels - April 15, 2011
GBP/JPY is developing corrective wave 4 of medium term uptrend - colored royal blue in the chart. Wave 4 has 2 subwaves within it (A-B), and subwave B is still developing - colored magenta in the chart. The targets of the upmove are Fibonacci retracements of 139.93-135.19, and expansions (if the price goes higher than 139.93) off 122.49-133.04-130.18 (waves 1-2), 130.18-139.93-135.19 (waves 3-4).

Resistances:

- 137.00 = .382 retracement
- 137.56 = .50 ret
- 138.12 = .618 ret
- 140.73 = objective point (OP)
- 141.22 = contracted objective point (COP)

If the price keeps declining the immediates supports will be Fibonacci retracements of 130.18-139.93, 122.49-139.93, and expansions off 139.93-135.19-136.96.

Supports:

- 135.06 = .50 retracement
- 134.03-133.90 = confluence area of COP and .618 retracement
- 133.27 = .382 ret
- 132.22 = OP


Overbought/Oversold

Assuming that the wave of a larger degree (corrective subwave B) is moving up it's preferable to open long positions when the Detrended Oscillator gets below the zero level (current prices) or into the oversold area (10-30 pips).


Performed by Roman Molodiashin, Analytical expert
InstaForex Companies Group © 2007-2011


EUR/USD wave analysis for April 15, 2011


In general, as expected, during yesterday’s trading the EUR/USD currency pair declined to the correction level 38.2%; afterwards it made an attempt to resume growth by reaching the 45 figure level by the end of the day. Therefore, the price has most likely completed the formation of the 4th wave (in the 5th). If so, then such resumed growth of the price has indicated the beginning of the 5th wave (in the 5th), at the same time targets for this 5th may be located in a quite wide range from the levels located slightly above the 45 figure level and up to the 1.4700 level.


Performed by Alexander Dneprovskiy, Analytical expert
InstaForex Companies Group © 2007-2011


USD/JPY wave analysis for April 15, 2011


Yesterday the USD/JPY currency pair continued to decline and tested the correction level 50.0% during the European session. At the same time, all downside movement initiated April 6 obtained the characteristics of a five-wave structure. Therefore, we might assume that inner wave structure of the 4th wave will become more complex and prolonged. Simultaneously, we should not eliminate the option supposing the resumption of downside movement of the pair in the direction of the levels located below the 77 figure level.


Performed by Alexander Dneprovskiy, Analytical expert
InstaForex Companies Group © 2007-2011


Register InstaForex Broker » Here
Saturday, April 16, 2011 | 0 comments | Read More

Fractal Analysis for March 03, 2011 (Daily Strategy)


GBP/USD Bearish Outlook , March 03, 2011 (Daily Strategy)


GBP/USD

Today, the important levels for British pound - United States dollar pair are 1.6365 (1st resistance) 1.6345 (fractal) , 1.6331 (fractal) 1.6296 (daily pivot).
An impulsive descendant movement can take place after the breakout of 1.6240

Now, the pair's downwards potential is stronger than ever, we predict a downwards movement towards the first, support monthly level around 1.6050.


Performed by Gerardo Porras Palomino, Analytical expert
InstaForex Companies Group © 2007-2011


Register InstaForex Broker » Here
Saturday, April 16, 2011 | 0 comments | Read More

Fundamental Analysis for April 15, 2011


The Fundamental Market Review for April 15, 2011


EUR/USD has been moving in a side diapason, yet, the EUR prospects appear to be brigher. So far the high of 1.4502 was registered for this currency pair with the low remaining at the level of 1.4440. However, the US dollar still lacks the opportunity to strengthen. Hopes for further increase in the interest rates on the part of the European central bank together with constant requests for buying Euro amid falling of Asian central banks and sovereign investment funds are likely to support the Euro at a high rate.

The ongoing debt problems of Portugal, Greece and Ireland serve for investors to remind of real risks related to the single currency. Moody’s rating agency cut the rating of Ireland from Baa3 to Baa1 and left its forecast negative. As the agency representatives inform, on Thursday Greece’s central bank governor George Provopoulos announced that debt restructuring will not be a solution to debt-related problems of the country. He added that Greece should step up reforms. "As I have often stated in the past, debt restructuring is neither necessary nor desirable--as it would create more problems than the ones that it would attempt to solve," Provopoulos said in an interview with Dow Jones Newswires. Member of the ECB's Executive Board Gertrude Tumpel-Gugerell claimed on Friday that the ECB believes in the capability of Greece to continue implementing the consolidation programme and in its ability to implement it without debt restructuring.

Investors expect a rather significant microeconomic statistics to be published today. It is to include the data on the US securities bought by foreigners, net capital inflow and national industrial production.


Performed by Natalia Grigorieva, Analytical expert

InstaForex Companies Group © 2007-2011


Register InstaForex Broker » Here
Saturday, April 16, 2011 | 1 comments | Read More

Scandi Daily 10.29

OVERVIEW – Despite the rate hike in Norway on Wednesday, the krone was very well offered on the back of some broad based currency liquidation and paring back of risk. The regional currencies were underperformers across the board with the krona getting hit even harder, on a less attractive yield differential and ongoing concerns over exposure to Eastern European markets and weaker than expected domestic data. The krona has been very tied to risk sentiment and any continued reduction in risk appetite should continue to weigh on the Scandi. The Nok should also come under some more pressure as investors’ interest rate expectations within the region become less aggressive. While the Norges Bank has been in a position to be able to raise rates, they also need to be conscience of rising asset prices and the threat of a double dip global recession. This is a point that has resonated with investors over the past few days.


Eur/Sek continues to consolidate off of the 2009 lows from August and we contend that the market is in the process of carving out a medium-term base. Any setbacks are expected to be well supported ahead of 10.05, with a break back above 10.45 to confirm basing prospects and accelerate gains.

Eur/Nok fresh yearly low last Thursday by 8.24 but we feel that the market is finally now exhausted and on the verge of some major upside over the medium-term.  The latest break back above 8.40 now confirms and should accelerate gains towards 8.50-60.  Only back below 8.30 would delay.

Usd/Sek traded down to a fresh yearly low by 6.75 on Monday ahead of the latest sharp reversal. Despite the underlying downtrend, our view is nevertheless constructive at current levels and favors USD appreciation over the coming weeks.  We contend the market is attempting to carve out a major base rather than in the process of some bearish consolidation. A break back above 7.10 should confirm bias and get things moving.


Usd/Nok has now officially carved out a meaningful low by 5.50 with the market racing higher on Wednesday to trigger a double bottom formation. The break back above the neckline at 5.66 now opens a measure move upside extension towards 5.80 over the coming sessions. More gains are seen on a break above 5.87.  Setbacks should now be well propped ahead of 5.60.

Gbp/Nok finally showing signs of recovery after basing out by 8.82 in the previous week. Daily studies show plenty of room for additional corrective upside, and we look for a push back towards 9.50 over the near-term. Setbacks should now be well supported ahead of 9.20.

Nok/Jpy as had be warned, the market was well overextended above 16.50 and the price has since collapsed into the well defined range. Deeper setbacks are now seen towards 15.50 over the coming sessions.

Written by Joel Kruger
Friday, October 30, 2009 | 1 comments | Read More

Currency Crosses: Technical Outlook

The EURNZD has rallied through 7 month trendline resistance and focus is now on 2.0750.  The Yen crosses have fallen rapidly from recent highs and the larger bullish patterns are in question.


Euro / British Pound


The EURGBP fell below .8985 but the decline may still be a 4th wave correction (I still favor a 5th wave advance through .9416 and maybe .9807).  Levels that could offer additional support are the 50% retracement of wave 3, which is at .8934 and the wave i of 3 high at .8843.  Coming below .8703 would signal that the larger trend is probably down.

Euro / Swiss Franc


“There is little to say about the EURCHF technically and there will not be until the pair breaks from the triangle. The fight between bulls and bears wages on in a triangle that has been underway since October. Triangles are typically continuation patterns, so a downside break seems more probable. Still, forecasting is an exercise in probabilities rather than certainties so jump the gun at your own risk. Pushing through either the top of bottom line triangle line would present a breakout opportunity.” The triangle count shown above is bearish but a bullish outcome is possible too. Wave a would be A and wave B would be a triangle.

Euro / Canadian Dollar


A head and shoulders top has been unfolding since January 2008.  The left shoulder was complex with 2 shoulders.  H&S patterns tend towards symmetry and I suggested last week that the EURCAD would rally to 1.6330 in order to form another right shoulder.  This scenario remains on track.

Euro / Australian Dollar


We viewed short term price action last week and concluded that “a rally above 1.6310 would break a series of lower highs, at least in the short term.  This would be the first sign of a bottom.”  The EURAUD did break higher and strategy is to now buy dips.  Support is 1.6310 and then 1.6240.

Euro / New Zealand Dollar


Last update was that “the EURNZD has bounced from a downward sloping line extended from the 6/22, and 8/14 lows (line also cuts through 3 days this month).  RSI has not confirmed the low (divergence), which leaves the downtrend weak technically and at risk of reversing.”   The EURNZD blasted through the multi month resistance line today, confirming a reversal.  Look to buy dips.  Support is 2.0240, 2.0110, then 2.0000.

Euro / Japanese Yen


Despite the significant decline in such a short amount of time, focus remains on the larger triangle pattern.  The next level of potential support is just above 132.  It certainly is possible that the rally from 129 is the last leg of strength that this pair sees in some time and that action since the Spring is distributive.  Whichever way the EURJPY decides to break in the coming weeks/months, the move should be substantial.

British Pound / Japanese Yen


The larger pattern depends on how the price pattern in the circled area is interpreted.  Treating that as a triangle and 5th wave thrust would indicate that the 5 wave rally from 139.68 is wave A of an A-B-C correction.  Treating the circled area as wave A and B of an expanded flat would indicate that the 5 wave rally is wave C and that a corrective rally is over.  The bigger picture is unclear but 147.05 is support (both structural and the 100% extension of 153.30-149.13.  149.60/80 is resistance.

Swiss Franc / Japanese Yen


The CHFJPY exceeded its 2009 high (barely), which was 91.56.  This fact should not be overlooked because the EURJPY failed to exceed its high (139.17).  This sets up a possible non-confirmation and potentially significant downside reversal.  Nothing is confirmed at this point of course.  87.20 is potential support.

Canadian Dollar / Japanese Yen


I am unsure of the action since early June but a triangle (similar to the EURJPY but lagging) could be unfolding.  The pair has dropped into a congestion area defined by 83 and 84.30.  Expect support at the lower end of the range.

Australian Dollar / Japanese Yen


I am unsure of the action since early June but a triangle (similar to the EURJPY but lagging) could be unfolding.  The pair has dropped into a congestion area defined by 83 and 84.30.  Expect support at the lower end of the range.

New Zealand Dollar / Japanese Yen


The NZDJPY reversed from a line drawn off of January, April, and June highs and is now testing channel support / that has held since the low as well as the 50 day SMA.  The battle lines are drawn.  Points to expect resistance are 66.60, 67.10, 67.60, and 68.05.

Written by Jamie Saettele
Friday, October 30, 2009 | 0 comments | Read More

Scandi Daily 10.28

OVERVIEW – There is a slew of data out in the region today with Swedish consumer confidence and retail sales kicking things off, followed by the Norwegian unemployment rate. However all of this will no doubt play a second fiddle to the more anticipated Norges Bank rate decision due out later in the day at 13:00GMT. The overwhelming consensus is that the Norges Bank will become the first European central bank to raise rates since the onset of the global financial markets crisis, with a 25bp hike to 1.50%. The Norwegian economy has been exceptionally strong throughout the global recession and this has now put the Norges Bank in a position to need to raise rates. One senior economist says that it is a “trade-off between the need for higher rates to curb the acceleration in home prices and the strength in private consumption” and “the effect of the krone exchange rate on consumption.” Norway will need to proceed with caution, especially with the timing of today’s decision coinciding with a global market sentiment that has now turned for the worse.


EURSEK DAILY

Charts created using Bloomberg – Prepared by Joel Kruger

Eur/Sek continues to consolidate off of the 2009 lows from August and we contend that the market is in the process of carving out a medium-term base. Any setbacks are expected to be well supported ahead of 10.05, with a break back above 10.45 to confirm basing prospects and accelerate gains.

Eur/Nok fresh yearly low last Thursday by 8.24 but we feel that the market is finally now exhausted and on the verge of some major upside over the medium-term.  Aggressive players can get long at current levels, with a break back above 8.40 accelerating.  Only back below 8.30 would delay.

Usd/Sek traded down to a fresh yearly low by 6.75 on Monday ahead of the latest sharp reversal to set up a bullish outside day formation on Monday. Despite the underlying downtrend, our view is nevertheless constructive at current levels and favors USD appreciation over the coming weeks.  We contend the market is attempting to carve out a major base rather than in the process of some bearish consolidation. Monday’s bullish reversal day should get things going but ultimately a break back above 7.10 will be required to officially shift the structure.

Usd/Nok is in the process of consolidating just off of the yearly lows by 5.50. However, given the medium-term stretched technical studies, we favor the risks for significant upside over the coming weeks with the market now in the process of attempting to carve out a meaningful base. Any additional setbacks should therefore be limited with the latest break and close back above the 20-Day SMA helping to reaffirm bullish outlook.

Gbp/Nok finally showing signs of recovery after basing out by 8.82 in the previous week. Daily studies show plenty of room for additional corrective upside, and we look for a push back towards 9.50 over the near-term. Setbacks should now be well supported ahead of 9.00. Look for a fresh upside extension on a break back above 9.30.

Nok/Jpy as had be warned, the market was well overextended above 16.50 and the market has since put in a bearish outside day on Monday. Look for the reversal day to mark a top by 16.63, with deeper setbacks now favored back towards initial support by 16.00 over the coming days. Only back above 16.63 negates.

Written by Joel Kruger
Thursday, October 29, 2009 | 0 comments | Read More

Scandi Daily 10.27

OVERVIEW – The developments in price action over the past 24 hours have been most interesting, with US equities and currencies coming back under pressure and the USD benefitting across the board. While most have attributed the moves to some natural profit taking from an overextended market, others have begun to once again weigh the risks to the prospect for a double dip type global recession. The wide spread consensus is that the Norges Bank will indeed raise rates on Wednesday by 25 bps to 1.50%, but the Norwegian central bank may grow a little more anxious with oil prices retreating and risk aversion back on the rise. Any threat of shift back into a contractionary market environment will surely bode unfavorably to central banks looking to adopt a more restrictive monetary policy. As such, while the local economy has indeed outperformed and separated itself throughout the global downturn, the Norges Bank also needs to be careful that it doesn’t unnecessarily expose itself to a premature and overly restrictive policy shift. Looking ahead, the calendar is all Sweden centric with the release of producer prices and household lending data at 8:30GMT.


Eur/Sek continues to consolidate off of the 2009 lows from August and we contend that the market is in the process of carving out a medium-term base. Any setbacks are expected to be well supported ahead of 10.05, with a break back above 10.45 to confirm basing prospects and accelerate gains. Initial resistance comes in by 10.22 with a break on Tuesday to reaffirm bias.

Eur/Nok fresh yearly low last Thursday by 8.24 but we feel that the market is finally now exhausted and on the verge of some major upside over the medium-term.  Aggressive players can get long at current levels, with a break back above 8.40 accelerating.  Only back below 8.30 would delay.

USD/SEK DAILY

Charts created using Bloomberg – Prepared by Joel Kruger

Usd/Sek traded down to a fresh yearly low by 6.75 on Monday ahead of the latest sharp reversal to set up a bullish outside day formation. Despite the current underlying downtrend, our view is nevertheless constructive at current levels and favors USD appreciation over the coming weeks.  We contend the market is attempting to carve out a major base rather than in the process of some bearish consolidation. Monday’s bullish reversal day should get things going but ultimately a break back above 7.10 will be required to officially shift the structure.

Usd/Nok is in the process of consolidating just off of the yearly lows by 5.50. However, given the medium-term stretched technical studies, we favor the risks for significant upside over the coming weeks with the market now in the process of attempting to carve out a meaningful base. Any additional setbacks should therefore be limited with a break and close back above the 20-Day SMA to reaffirm bullish outlook.

Gbp/Nok finally showing signs of recovery after basing out by 8.82 in the previous week. Daily studies show plenty of room for additional corrective upside, and we look for a push back towards 9.50 over the near-term. Setbacks should now be well supported ahead of 9.00. Look for a fresh upside extension on a break back above 9.30.

Nok/Jpy as had be warned, the market was well overextended above 16.50 and the market has since put in a bearish outside day on Monday. Look for the reversal day to mark a top by  16.63, with deeper setbacks now favored back towards initial support by 16.00 over the coming days. Only back above 16.63 negates.

Written by Joel Kruger
Tuesday, October 27, 2009 | 0 comments | Read More

Forex Options and Futures Support Calls for US Dollar Bottom, Euro Top

Forex Options and Futures markets show US Dollar sentiment at near-record bearish extremes against almost all major counterparts, and one-sided positioning suggests that the USD is near a major turning point. Today’s US Dollar pullback may in fact be the start of a bigger reversal. The key difficulty remains the timing of said turnaround, as US Dollar-bearish sentiment has remained extreme for quite some time now. According to our Senior Strategist, the Euro/US Dollar’s break below 1.4980 is the first sign of a top.


Volatility expectations have jumped considerably on recent US Dollar losses. We typically see important market turns when volatility is at or near its peak. Of course, guessing the peak for Forex Options Market implied volatility levels is a feat onto itself. As it stands, we recognize that the US Dollar may continue lower through short-term trading. Yet every further USD short only increases the likelihood of an important market corrections and-by extension-a Dollar recovery.


Euro/US Dollar Forex Options and Futures Forecast


Futures positioning shows that Non-Commercial traders (typically large speculators) had become extremely net-long the Euro against the US Dollar. In fact, said speculative positioning is was previously the most long it had been since the Euro traded near 1.6000 in early 2008. We consistently warn that extreme positioning and sentiment can and does remain extreme for extended periods of time. Yet it is interesting to point out EURUSD has set a noteworthy top.

British Pound/US Dollar Forex Options and Futures Forecast


Futures and Options sentiment paint a distinctively different picture for the British Pound against the US Dollar, as traders had actually grown extremely short the GBP against the USD. The GBPUSD very recently rallied on aggressive speculative short covering, and indeed Net Non-Commercial short positioning went from -65,346 contracts to -43,318 through the week ending October, 20. This fairly substantial shift is perhaps only the earliest stage of a larger unwind.

US Dollar/Japanese Yen Forex Options and Futures Forecast


Forex options markets show that traders are the most bullish the USDJPY (Bearish the Japanese Yen) in the past 90 trading days, while the longer-term trend in price shows we are in a fairly clear downtrend. The FX options market sentiment extremes suggest that we may have hit a USDJPY top and it is likely to continue its longer-term correction. The major caveat is that Futures positioning actually shows speculators still fairly short the USDJPY (long Yen), and a pullback in speculative interest could fuel a USDJPY rally. The mixed signals give us a fairly neutral bias on the USDJPY.

US Dollar/Canadian Dollar Forex Options and Futures Forecast


Traders have grown extremely net-long the Canadian dollar (short the USDCAD) through recent trade, with FX Futures data showing sentiment at its most bullish since the pair traded near parity. We have continued to call for a USDCAD reversal, and the very recent rally suggests we may have set a substantive USDCAD bottom. It stands to reason that a further unwind in positioning would result in further Canadian dollar losses (USDCAD rallies).

US Dollar/Swiss Franc Forex Options and Futures Forecast


Non-Commercial futures positioning on the US Dollar/Swiss Franc pair remains the most bearish in nearly 5 years-pointing to clear sentiment extremes. Swiss Franc long positions (USDCHF shorts) outnumber short positions by a over 20,000, and it is little surprise to note that the USDCHF trades very near parity. Yet the last time net-long CHF positions grew to this level was in December, 2004. At that point the USDCHF set an important low. Watch for further rallies.

Australian Dollar/US Dollar Forex Options and Futures Forecast


We continue to call for a sustained Australian dollar pullback, as sentiment has remained extreme for quite some time now. Non-commercial futures traders remain the most net-long the AUDUSD since the pair traded above 0.90, but the timing of said retracement remains extremely challenging. Forex options market sentiment has hit similarly overextended bullish extremes.

New Zealand Dollar/US Dollar Forex Options and Futures Forecast


The New Zealand dollar/US Dollar pair is quite similar to the AUDUSD, with significant sentiment extremes leaving the door open for near-term declines. As of several weeks ago, Net Non-Commercial positioning on NZDUSD futures remained the most net-long since the pair set noteworthy tops in July, 2007.

Written by David Rodriguez
Tuesday, October 27, 2009 | 0 comments | Read More